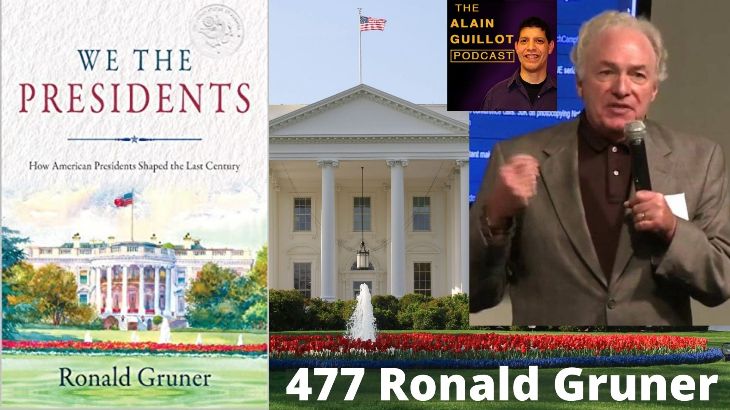
About Ronald Gruner

Ronald Gruner founded, served as chief executive, and sold three successful technology firms during his long career: Alliant Computer in 1982, Shareholder. com in 1993 and Sky Analytics in 2009.
Each of Gruner’s firms was a pioneer and leader in its industry: Alliant in parallel processing, Shareholder.com in investor relations, and Sky in legal analytics. Unlike many technology firms, each company delivered a healthy financial return to its investors.
Alliant went public in 1986 while Shareholder.com and Sky Analytics were profitably acquired by major public corporations in 2006 and 2015, respectively.
During his thirty-five years as a chief executive, Gruner faced the challenges of making difficult decisions; balancing the interests of shareholders, customers and employees; and focusing on the long-term even as short-term pressures seemed overwhelming.
Gruner’s experience as an accomplished executive has resulted in a different breed of presidential history. Taken from his business experience, We the Presidents focuses on effects rather than causes, on results rather than politics; on economics rather than ideology; and WE THE PRESIDENTS on the connections linking presidential administrations rather than isolated presidencies.
Gruner lives with his wife, Nancy, in Naples, Florida where he is a private pilot, amateur radio operator, and consistently poor golfer.
Where to find Ronald Gruner
We the Presidents: How American Presidents Shaped the Last Century
WE THE PRESIDENTS explores how American presidents over the last century, from Warren G. Harding to Donald Trump, have shaped today’s issues.

Every generation tends to believe they live in unique times, but immigration, healthcare, civil rights, tax policy, income distribution, globalization, and the evolving role of government have all had their roots in earlier presidencies — and continue to affect every American today.
Unlike most presidential biographies, WE THE PRESIDENTS is devoid of politics. A successful presidency is not based on political battles won, but rather the well-being and prosperity of ordinary citizens. For most Americans, that’s closely related to their pocketbooks. So, throughout the book are discussions covering economic growth, personal income (and income inequality), taxation, and related topics affecting every American.
It’s these issues, evolving over decades, that have woven the American tapestry. WE THE PRESIDENTS tell a small part of that remarkable story.
List of presidents from Warren G. Harding to Donald Trump and their returns on the S&P 500
- Warren Harding 1921–1923
- Calvin Coolidge 1923–1929
- Herbert Hoover 1929–1933
- Franklin D. Roosevelt 1933–1945
- Harry S. Truman, 1945–1953, 87%
- Dwight Eisenhower 1953–1961, 129%
- John F. Kennedy 1961–1963, 16%
- Lyndon Johnson 1963–1969, 46%
- Richard Nixon 1969–1974, -20%
- Gerald Ford 1974–1977, 26%
- Jimmy Carter 1977–1981, 28%
- Ronald Reagan 1981–1989, 117%
- George H. W. Bush 1989–1993, 51%
- William J. Clinton 1993–2001, 210%
- George W. Bush 2001–2009, -40%
- Barack Obama 2009–2017, 182%
- Donald J. Trump 2017–2021, 43%
Conventional wisdom says that those liberal Dems are generally bad for the economy and the stock market because of their big-government tendencies, while fiscally conservative Republicans are good.
However, stock markets have perform better under Democrats than under Republicans. From 1952 through June 2020, annualized real stock market returns under Democrats have been 10.6% compared with 4.8% for Republicans.
Bull markets and bear markets come and go, and it’s more to do with business cycles, demographic changes, and technological advances than presidents.
The winner among presidents for the best cumulative stock market return is William J. Clinton, with nearly 210%. The worst: George W. Bush, with -40%.
Uncertainty has been the biggest disrupter of markets by far. In September 1955, for example, stocks dove 6.5% in a single day when Eisenhower suffered a sudden heart attack after a golf outing. When Kennedy was assassinated in November 1963 the immediate fall off was 3%. In both instances, stocks promptly recovered. Market gyrations aside, investors can take comfort in the fact that in the long run, buy and hold worked best. A $1,000 investment in an index of large U.S. stocks in January 1945, would have compounded at an annual total return of 11% and would have been worth $2.3 million by the end of 2019.
